The middle of March seems to be eventful for some reason. We’ve had Julius Caesar assassinated, tsunamis hit Japan, an assault by a virus, March Madness, and market misbehavior. The middle of March also has some personal headlines for me.
The last time we went through this, we just had our first child and I just changed jobs. This time, we now have a child starting (but apparently not finishing) Middle School and my wife just changed jobs.
2008 - My son Nathan was born on March 10th. You may remember it as the day that Elliott Spitzer, the Governor of New York, got caught in an escort scandal or the day that oil reached $108 a barrel and how much you were paying for gas. This was also the week that Bear Stearns had their financial issues brought to light.
2009 - The stock market finally bottomed from the Great Financial Crisis on March 9th. It would go down an additional 45% from when my son was born.
2010 - My daughter Shannon was born on March 9th. The market has rebounded 74% since the bottom the previous year, but still 5% lower from when Nathan was born.
What makes this interesting is drives my curiosity on how the markets did around that two year time period and how they have done since. Most importantly, I would like you to consider the optics of these different timeframes around Nathan (03/10/08) and Shannon’s (03/09/10) birthdays and how you felt about it at the time.
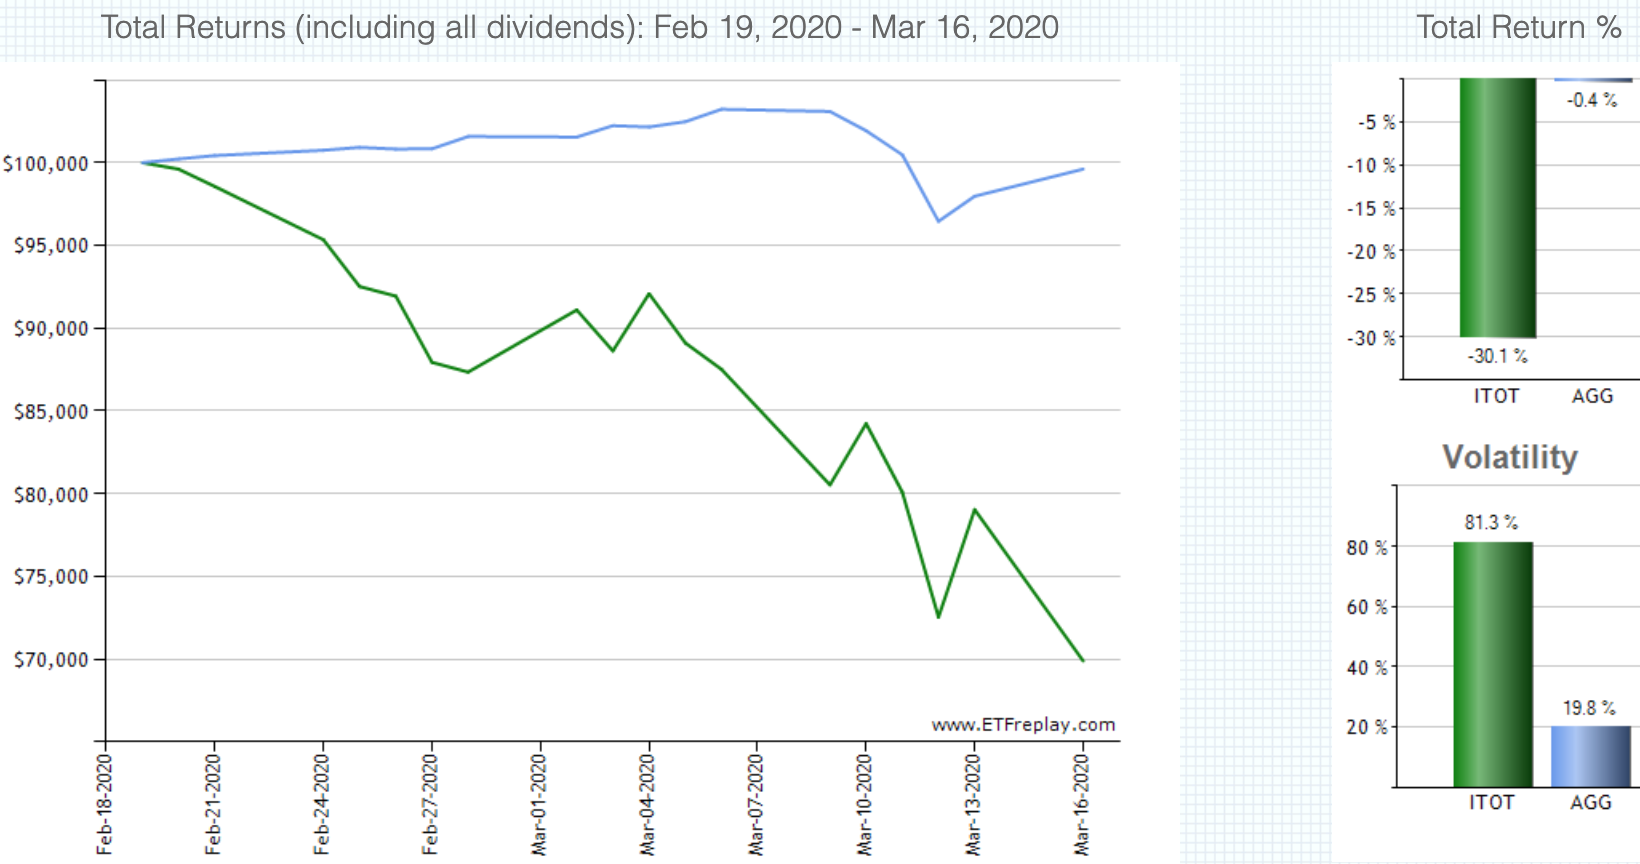
Here is the year before the GFC bottom (when Nathan was born to the GFC bottom). ITOT is the S&P1500 Total Market Index and AGG is the Aggregate Bond Index.

Here is the year from the bottom to when Shannon was born. The market was up over 70%.

Here is what it looks like when you put the two together:

Now let’s change the optics from from GFC low to today. The peak-to-trough drop, including dividends for the S&P1500 was 55.2%. Probably more importantly, the value of the market, when you account for dividends took 4.5 years to return to its October 2007 highs. 18 months down, three years up. What kind of growth rate does that compute to be today if we are already at the bottom? It’s about 12.6%.

What if we continue down to the drop we saw in 2007-09? To recover in three years, it comes to 30.6%
We can’t count on that. We have to count on ourselves. Things are different. Specifically, the bond market is not acting normal compared to previous market drops.
Last time:

This time bonds are offering as much:
What can we do today?
The best thing you can do for your future returns is treat this like an opportunity, not a threat. This can take the form of changing your future contributions or a Roth Conversion. The key is to have a plan to get back into the game without emotional influence.
Past performance is not indicative of future results, but it may help you contextualize your feelings and actions and how that worked out. Not accounting for dividends, that would take the S&P would have to drop from its February 19, 2020 high of 3389 to 1518 (we are at 2422 as I type this so imagine going down another 31% from these levels. We are “only” down 35% right now.
You know how you reacted, you know what the outcome was. Use that knowledge to create a plan for this time. Life is going to change. Some of those things you have control over. Others you don’t. Learn from yourself and your previous responses and create better outcomes going forward.